Data Mining Functions, Procedure and Strategies Explained
Data mining functions are tasks that are carried out by algorithms in the process of transforming raw data to implicit information. Data mining procedure is the sum total of all stages comprising various tasks or functions by which information is extracted from data. Data mining strategies are pre-planned approaches that comprise of functions and procedures to transform raw data and extract information.
This article discusses data mining functions, procedure and strategies, as outlined below;
Data Mining Functions
Data mining functions (or data mining functionalities) are specific operations or tasks that are carried out by algorithms in the process of extracting implicit knowledge from raw datasets.
Some studies may use the terms functions and techniques of data mining in an interchangeable manner. In other cases, data mining methods or techniques may be listed as examples of data mining functions, and vice-versa.
While they are interrelated concepts (that is; methods, techniques and functions), the data mining functions are unique in terms of their specification to particular projects or problems.
On the other hand, it is often correct to use the terms data mining functions and data mining algorithms, interchangeably. This is because the algorithms for data mining are named according to their primary functions, in several cases
There are numerous functions or tasks used in data mining, such as; K-means Clustering, Linear Regression Analysis, Expectation-Maximization, and Decision-Tree Visualization. Each is discussed briefly below;
1). K-means Clustering (as one of the Data Mining Functions)
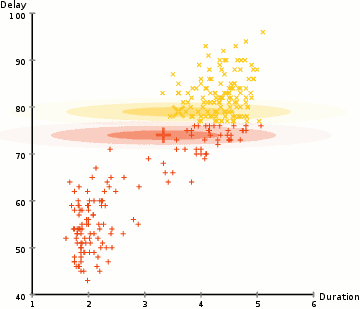
K-means clustering is a data mining function that is based on a descriptive algorithm that categorizes large complex datasets into small groups called clusters, based on similarities in attributes [5].
The K-means clustering function works by automatic skimming of large datasets assignment of labels to data points according to attributes of size, format or distribution, and convergence of data points with identical labels.
An example of the use of K-means clustering function, is the categorization of customer service data based on demographic similarity.
K-means clustering algorithms search for unifying attributes called centroids, which can be used to link dispersed data points to each other. The function is particularly essential when dealing with large datasets that have a high level of heterogeneity.

2). Linear Regression Analysis
Linear regression analysis in data mining is a function whereby trends of progressive linear sequence are revealed among data points in a large database.
The mathematical expression of linear regression is straight line equation; Y = a + b × X, where X and Y are independent variables (data points), a is the y-intersect of the line formed by plotting X against Y values, and b is the slope of the same line [6].
Basically, the linear regression function is used where the data has a numeric attribute that relates various data points to each other based on simple multiples.
Regression is itself a technique that is used for prediction, so that the regressive trends revealed can be used to predict future outcomes in a data-based system. Regression analysis can be useful for stock price prediction, among other number-based data prediction projects.
Multiple linear regression analysis is a variant of linear regression analysis, whose main purpose is to recognize and predict patterns in datasets which contain variables that are related by more than one linear sequential trend.
3). Expectation-Maximization (as one of the Data Mining Functions)
Expectation-Maximization is a two-stage data mining function or algorithm, that extracts information from datasets by modifying them with estimated data points based on observed patterns.
The two steps in expectation-maximization algorithm are; expectation stage, which involves the completion of data using estimated points (based on observed trends), and maximization stage, in which the data model is re-evaluated or re-estimated for functionality after it has been completed [4].
Expectation maximization can be used where the available data contains several unmatched points that do not produce a consistent progressive pattern. The EM function helps to complete such data in order to transform it into coherent information.

4). Decision-Tree Visualization
A decision tree in data mining is a descriptive model which places similar data points in groups that are arranged in a hierarchical order with respect to each other, based on relative scope and priority.
Decision-tree visualization is a data mining function that uses algorithmic classifiers to group data points into clusters and arrange these clusters hierarchically in a presentable format for interpretation [2].
The visualization of decision trees is useful for simplification of processed data.
Data mining algorithms are rules developed to carry out the data mining functions. An example is C4.5 algorithm for decision-tree visualization [3].
Data Mining Procedure
The data mining procedure comprises of multiple functions/tasks that are carried out in a sequential order to transform raw data to usable information. These functions constitute what is described as the stages of data mining (or steps in data mining process).
Stages of data mining are, data acquisition, integration, processing (analysis, reduction, transformation) pattern recognition (modeling) and knowledge representation.
Data acquisition and integration are preliminary stages in the data mining procedure, which lead to the collection of data from multiple sources (like smart devices in an IoT network), and the reduction of heterogeneity as these datasets are converged.
In data processing, the converged datasets are transformed into a more interpretable format.
Pattern recognition and knowledge representation both involve modeling the processed data to highlight observable trends and anomalies that can give potentially-useful information to an analyst or user [1].
Data Mining Strategies
Data mining strategies are the sum total of functions or tasks, and procedures used in a data mining project.
The selected functions and procedures that comprise a given data mining strategy are usually selected based on multiple criteria that include;
1). Project scale
2). Complexity
3). Aim
4). Objectives
Conclusion
Data mining functions are tasks based on specific rules that have been developed to process data and reveal interpretable, predictable ends. Examples of data mining functions are; K-means Clustering, Linear Regression Analysis, Expectation-Maximization, Decision-Tree Visualization
The data mining procedure is a collection of tasks that are carried out for the common purpose of extracting knowledge from raw data.
Data mining strategies are made up of selected functions and procedures based on scale, complexity, aim and objectives of a given project.
References
1). Agrawal, S.; Agrawal, J. (2015). "Survey on Anomaly Detection using Data Mining Techniques." Procedia Computer Science 60(1):708-713. Available at: https://doi.org/10.1016/j.procs.2015.08.220. (Accessed 22 March 2023).
2). Barlow, S. T.; Neville, P. (2001). "Case Study: Visualization for Decision Tree Analysis in Data Mining." IEEE Symposium on Information Visualization 2001 (INFOVIS'01), San Diego, CA, USA, October 22-23, 2001. Available at: https://doi.org/10.1109/INFVIS.2001.963292. (Accessed 22 March 2023).
3). Das, S.; Dahiya, S.; Bharadwaj, A. (2014). "An online software for decision tree classification and visualization using c4.5 algorithm (ODTC)." 2014 International Conference on Computing for Sustainable Global Development (INDIACom), New Delhi, India, 2014, pp. 962-965, Available at: https://doi.org/10.1109/IndiaCom.2014.6828107. (Accessed 22 March 2023).
4). Do, C.; Batzoglou, S. (2008). "What is the expectation maximization algorithm?" Nat Biotechnol 26, 897–899 (2008). Available at: https://doi.org/10.1038/nbt1406. (Accessed 22 March 2023).
5). Hussein, A. A.; Oluwaseun, A. (2019). "Data Mining Application Using Clustering Techniques (K-Means Algorithm) In The Analysis Of Student's Result." Available at: https://www.researchgate.net/publication/333508765_Data_Mining_Application_Using_Clustering_Techniques_K-Means_Algorithm_In_The_Analysis_Of_Student's_Result. (Accessed 22 March 2023).
6). Schneider, A.; Hommel, G.; Blettner, M. (2010). "Linear regression analysis: part 14 of a series on evaluation of scientific publications." Dtsch Arztebl Int. 2010 Nov;107(44):776-82. Available at: https://doi.org/10.3238/arztebl.2010.0776. (Accessed 22 March 2023).