5 Examples of Pyramid of Biomass Explained
Examples of pyramid of biomass are; 4-level soil-microbial biomass pyramid, inverted aquatic biomass pyramid, forest biomass pyramid, tundra biomass pyramid, and 5-level desert biomass pyramid.
This article discusses some examples of pyramid of biomass, as follows;
1). Soil Microbial Biomass Pyramid (as one of the Examples of Pyramid of Biomass)
Soil-Microbial Biomass Pyramid Trophic Levels: Photosynthetic Bacteria (largest dry mass)→ Nematodes→ Micro-arthropods→ Arthropods (least dry mass)
As the name implies, soil microbial biomass pyramid is dominantly occupied by microscopic soil organisms.
At the bottom of the microbial biomass pyramid, producers like photosynthetic bacteria can be found (Level 1). The total dry biomass of these organisms is usually highest among all trophic levels in the soil microbial food chain or energy pyramid.
This is because the ability of photosynthetic bacteria (like Cyanobacteria) to manufacture their own food from renewable resources like solar energy, enables them grow rapidly and densely in soil. Studies have shown that the dry-weight specific gravity of photosynthetic bacteria in soil can be as high as 1.4 g/cm3 [3].
In Level 2, nematodes like Protorhabditis hortulana constitute the primary consumers, and can be described as being 'bacterivorous' due to their dependence on bacteria as a food source. The metabolic interaction between nematodes in soil and photosynthetic bacteria, goes a long way to determine nutrient distribution and other physicochemical conditions [1].
This means that nematodes play a role in natural soil conservation, by reason of their position in the soil energy and biomass pyramids.
With regards to total dry organic mass, nematodes in level 2 of the soil microbial ecosystem will generally have a lower amount of biomass than photosynthetic bacteria; so that where bacteria has a total mass of 140 grams across a 100 cm3 area of soil to a specific depth, bacterivorous nematodes may have a total mass of about 14-20 grams within the same area and depth of soil.
This means that the trend of sequence in a soil microbial biomass pyramid is tapering-upward, with larger amount of biomass at lower trophic levels, and continuous decrease in total biomass as we progress upward.
Micro-arthropods and (macro) arthropods like centipedes may occupy Levels 3 and 4 for secondary and tertiary consumers respectively, where the micro arthropods prey on nematodes and the arthropods prey on the micro-arthropods.

2). Inverted Aquatic Biomass Pyramid
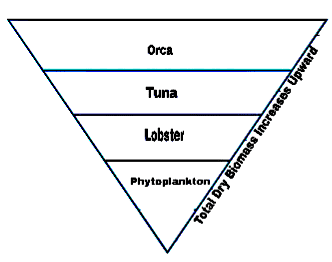
Inverted-Aquatic Biomass Pyramid Trophic Levels: Phytoplankton (least dry mass)→ Crustaceans→ Fish→ Orca (largest dry mass)
Freshwater, brackish and marine food chains are all ecologic energy-transfer concepts that depict the conditions of aquatic ecosystems in similar manner to an inverted biomass pyramid.
The inverted pyramid of biomass in aquatic ecosystems, is a representation of total dry biomass at various trophic levels of water-dominated biomes; which reveals that lower trophic levels have lower amounts of biomass in these aquatic ecosystems, unlike terrestrial ecosystems that have larger amount of biomass at lower trophic levels.
Pyramid of biomass is inverted in ponds and other aquatic systems because producers like phytoplankton, though numerous, are much smaller in size per-organism than primary, secondary and tertiary consumers.
The sheer increase in natural size as we move up the trophic levels of an aquatic ecosystem (such as the comparison between a tuna and an orca) results in more biomass being produced by growing organisms in higher levels than those growing in lower trophic levels.
Aquatic vs terrestrial biomass pyramid comparison, shows that the presence of soil and higher intensity of solar radiation, helps producers in terrestrial eco-regions like forests, grasslands and even deserts, to grow more widely and densely than in aquatic ecosystem where most solar radiation penetrates only to a limited depth from the surface.
It must also be noted that the size difference between aquatic and terrestrial producers is enormous, with terrestrial producers including large trees that cannot occur in aquatic ecosystems.
The main difference between aquatic and terrestrial biomass pyramids is their geometric trend; where aquatic pyramids increase-upward and terrestrial pyramids decrease or taper-upward.
Below is a table that summarizes the aquatic vs terrestrial biomass pyramid comparison;
Comparison Criteria | Aquatic Biomass Pyramid | Terrestrial Biomass Pyramid |
Trend | Widening/Increasing-Upward | Tapering/Decreasing-Upward |
Geometry | Polygonal, Inverted | Polygonal, Upright |
Dominant Producers | Microbes, aquatic plants | Vascular terrestrial plants |
Trend-Causative Factor | Relatively-small producer size, shallow sunlight penetration | Relatively-large producer size, higher solar intensity |

3). Forest Biomass Pyramid (as one of the Examples of Pyramid of Biomass)
Forest-Biomass Pyramid Trophic Levels: Douglas fir (largest dry mass)→Red Squirrel→ Bobcat→ Grey Wolf (least dry mass)
The pyramid of biomass of forests and other tree-dominated regions starts at Level 1 with producers like the Douglas fir, whose seeds serve as food to primary consumers like the red squirrel (Level 2).
The bobcat represents a carnivorous secondary consumer (Level 3) in temperate forests, whose diets consists of primary consumers like the red squirrel. It is however more vulnerable than the grey wolf, who is both competitor and predator to the bobcat; thereby serving as a tertiary consumer (Level 4).
Because of their high biodiversity and species richness, all types of forests can feature a fifth trophic level, occupied by the quaternary consumer or apex predator. For temperate forests, these predators may be represented by omnivorous animals like bears.
A forest biomass pyramid is always tapering upward under natural circumstances, because the growth of producers is highly favored by abundant soil, organic humus and solar radiation.
4). Tundra Biomass Pyramid
Tundra-Biomass Pyramid Trophic Levels: Caribou Moss (largest dry mass)→ Microtus oeconomus →Snowy Owl→ Arctic Fox (least dry mass)
The main trophic levels in a tundra ecosystem are; producer, primary, secondary, and tertiary consumers (Levels 1-4). Large predators like polar bears or wolves may also act as quaternary consumers (Level 5) in some cases.
Microtus oeconomus, also called tundra vole or root vole is an example of a primary consumer (Level 2), that feeds on plant matter like caribou moss for its nutrition.
The snowy owl and arctic fox can act as secondary and tertiary consumers (Levels 4, 5) in a tundra ecosystem, respectively. Biomass is transferred effectively along with bioenergy through feeding relationships across the different trophic levels.
Like forests, the biomass pyramid of a tundra is generally upright, with more dry biomass at lower trophic levels than higher ones. The reason for this is a combination of climatic, edaphic and biological factors that restrict both population size and individual mass of consumers.

5). 5-Level Desert Biomass Pyramid (as one of the Examples of Pyramid of Biomass)
Desert-Biomass Pyramid Trophic Levels: Creosote Bush (largest dry mass)→Black-tailed Jackrabbit →Rattlesnake (Crotalus spp.) →Red-tailed Hawk →Great Horned Owl (least dry mass)
The energy pyramid of the desert ecosystem assumes a similar trend to the biomass pyramid of the same ecosystem; which is a tapering-upward trend.
Biomass in the desert comprises mostly of plants, which are the primary producers (Trophic level 1). Examples of such plants is the creosote bush, whose adaptive root system and transpiration mechanism, allow it to survive the harsh desert climate.
Black-tailed jackrabbit is a herbivorous rodent with minimal calorific demands, whose plant-feeding and burrowing behaviors help it find sufficient food while eluding predators like the rattlesnake, whose role in the biomass pyramid is that of secondary consumer.
Raptors like the red-tailed hawk can in turn derive biomass and energy by feeding on the rattle snake, making the hawk a tertiary consumer (Level 4).
In spite of its advantages of altitude, keen sensitivity, and speed, the red-tailed hawk faces threat from other opportunistic desert predators like the great horned owl, which can prey on eyasses and eggs of the hawk [2]. This places the great horned owl in trophic level 5, as a quaternary consumer.
Conclusion
Examples of pyramid of biomass (with trophic levels) are;
1. 4-Level Soil Microbial Pyramid
2. 4-Level Inverted Aquatic Pyramid
3. 4-Level Forest Pyramid
4. 4-Level Tundra Pyramid
5. 5-Level Desert Biomass Pyramid
References
1). Blanc, C.; Sy, M.; Djigal, D.; Brauman, A.; Normand, P.; Villenave, C. (2006). "Nutrition on bacteria by bacterial-feeding nematodes and consequences on the structure of soil bacterial community." European Journal of Soil Biology 42. Available at: https://doi.org/10.1016/j.ejsobi.2006.06.003. (Accessed 12 April 2023).
2). Springer, M. A.; Kirkley, J. S. (1978). "Inter and Intraspecific Interactions Between Red-Tailed Hawks and Great Horned Owls in Central Ohio." The Ohio Journal of Science. v78, n6 (November, 1978), 323-328. Available at: https://kb.osu.edu/handle/1811/22576. (Accessed 12 April 2023).
3). van Veen, J. A.; Paul, E. A. (1979). "Conversion of biovolume measurements of soil organisms, grown under various moisture tensions, to biomass and their nutrient content." Appl Environ Microbiol. 1979 Apr;37(4):686-92. Available at: https://doi.org/10.1128/aem.37.4.686-692.1979. (Accessed 12 April 2023).